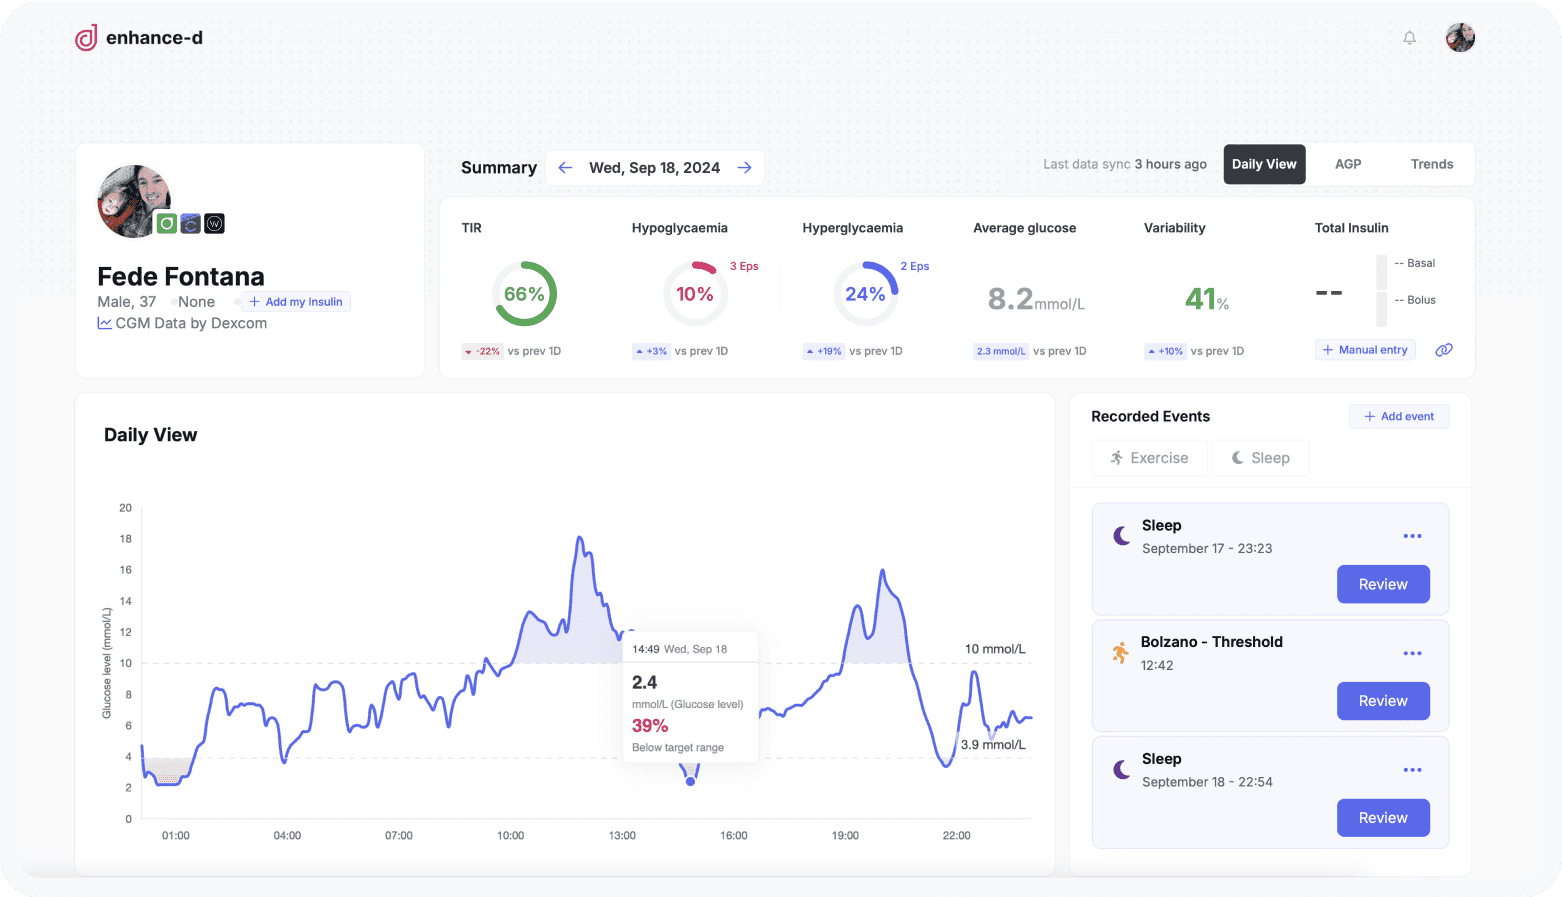
TIR, hypo, hyper, average glucose, variability & insulin
Three ways to read the same story
CGM, insulin & wearable integrations
Granular sharing with your clinic and coaches
AGP
The ambulatory glucose profile, your way
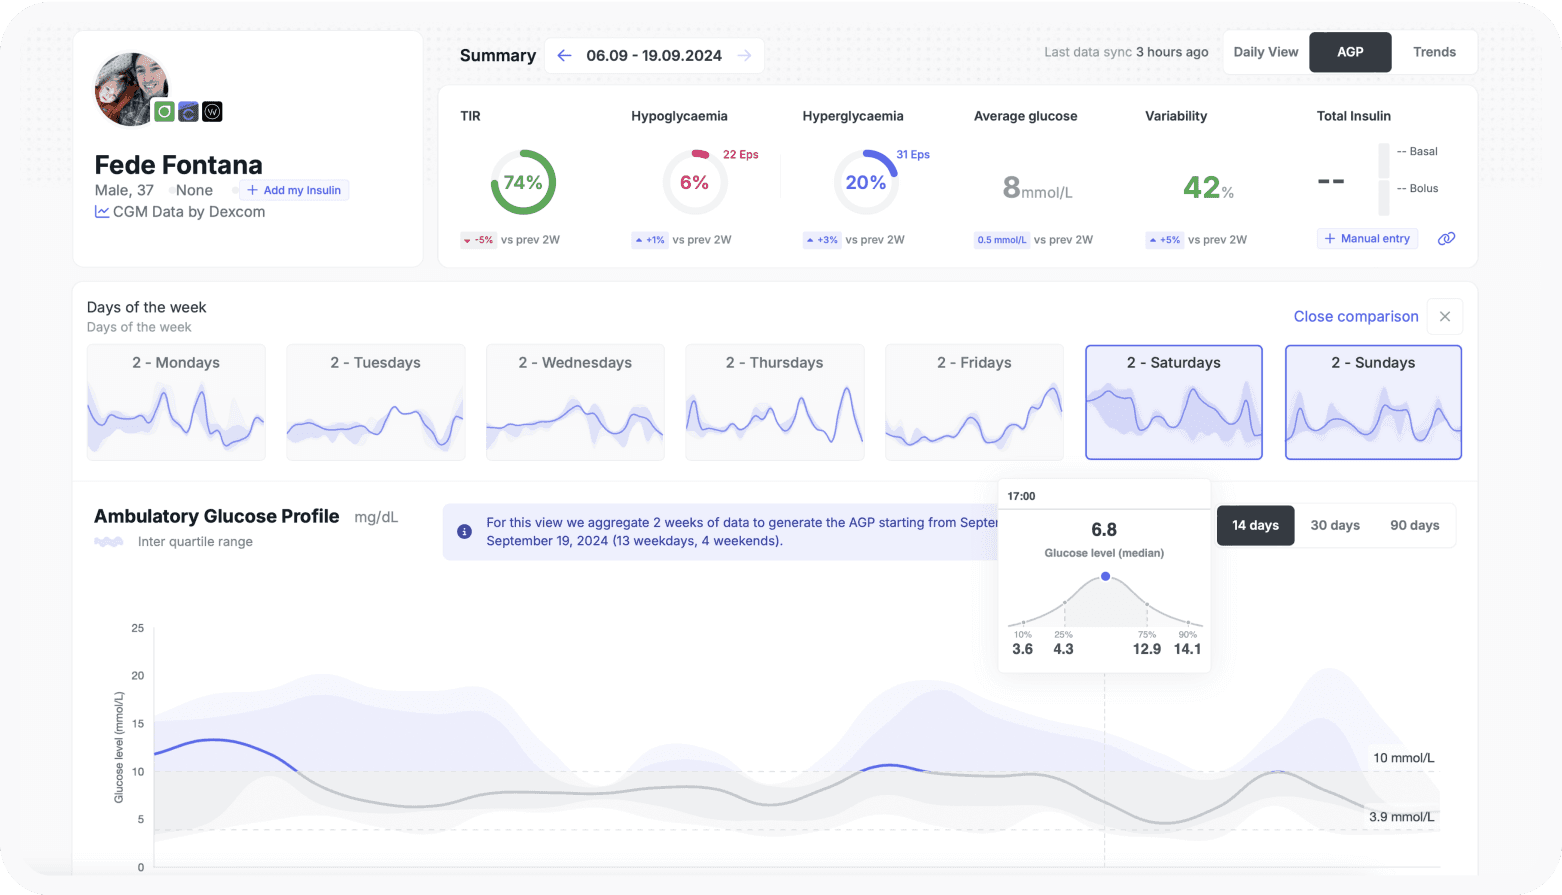
See the AGP your clinic already knows over 14, 30 or 90 days - then switch on weekday comparison to spot which days of the week behave differently.
Exercise detail
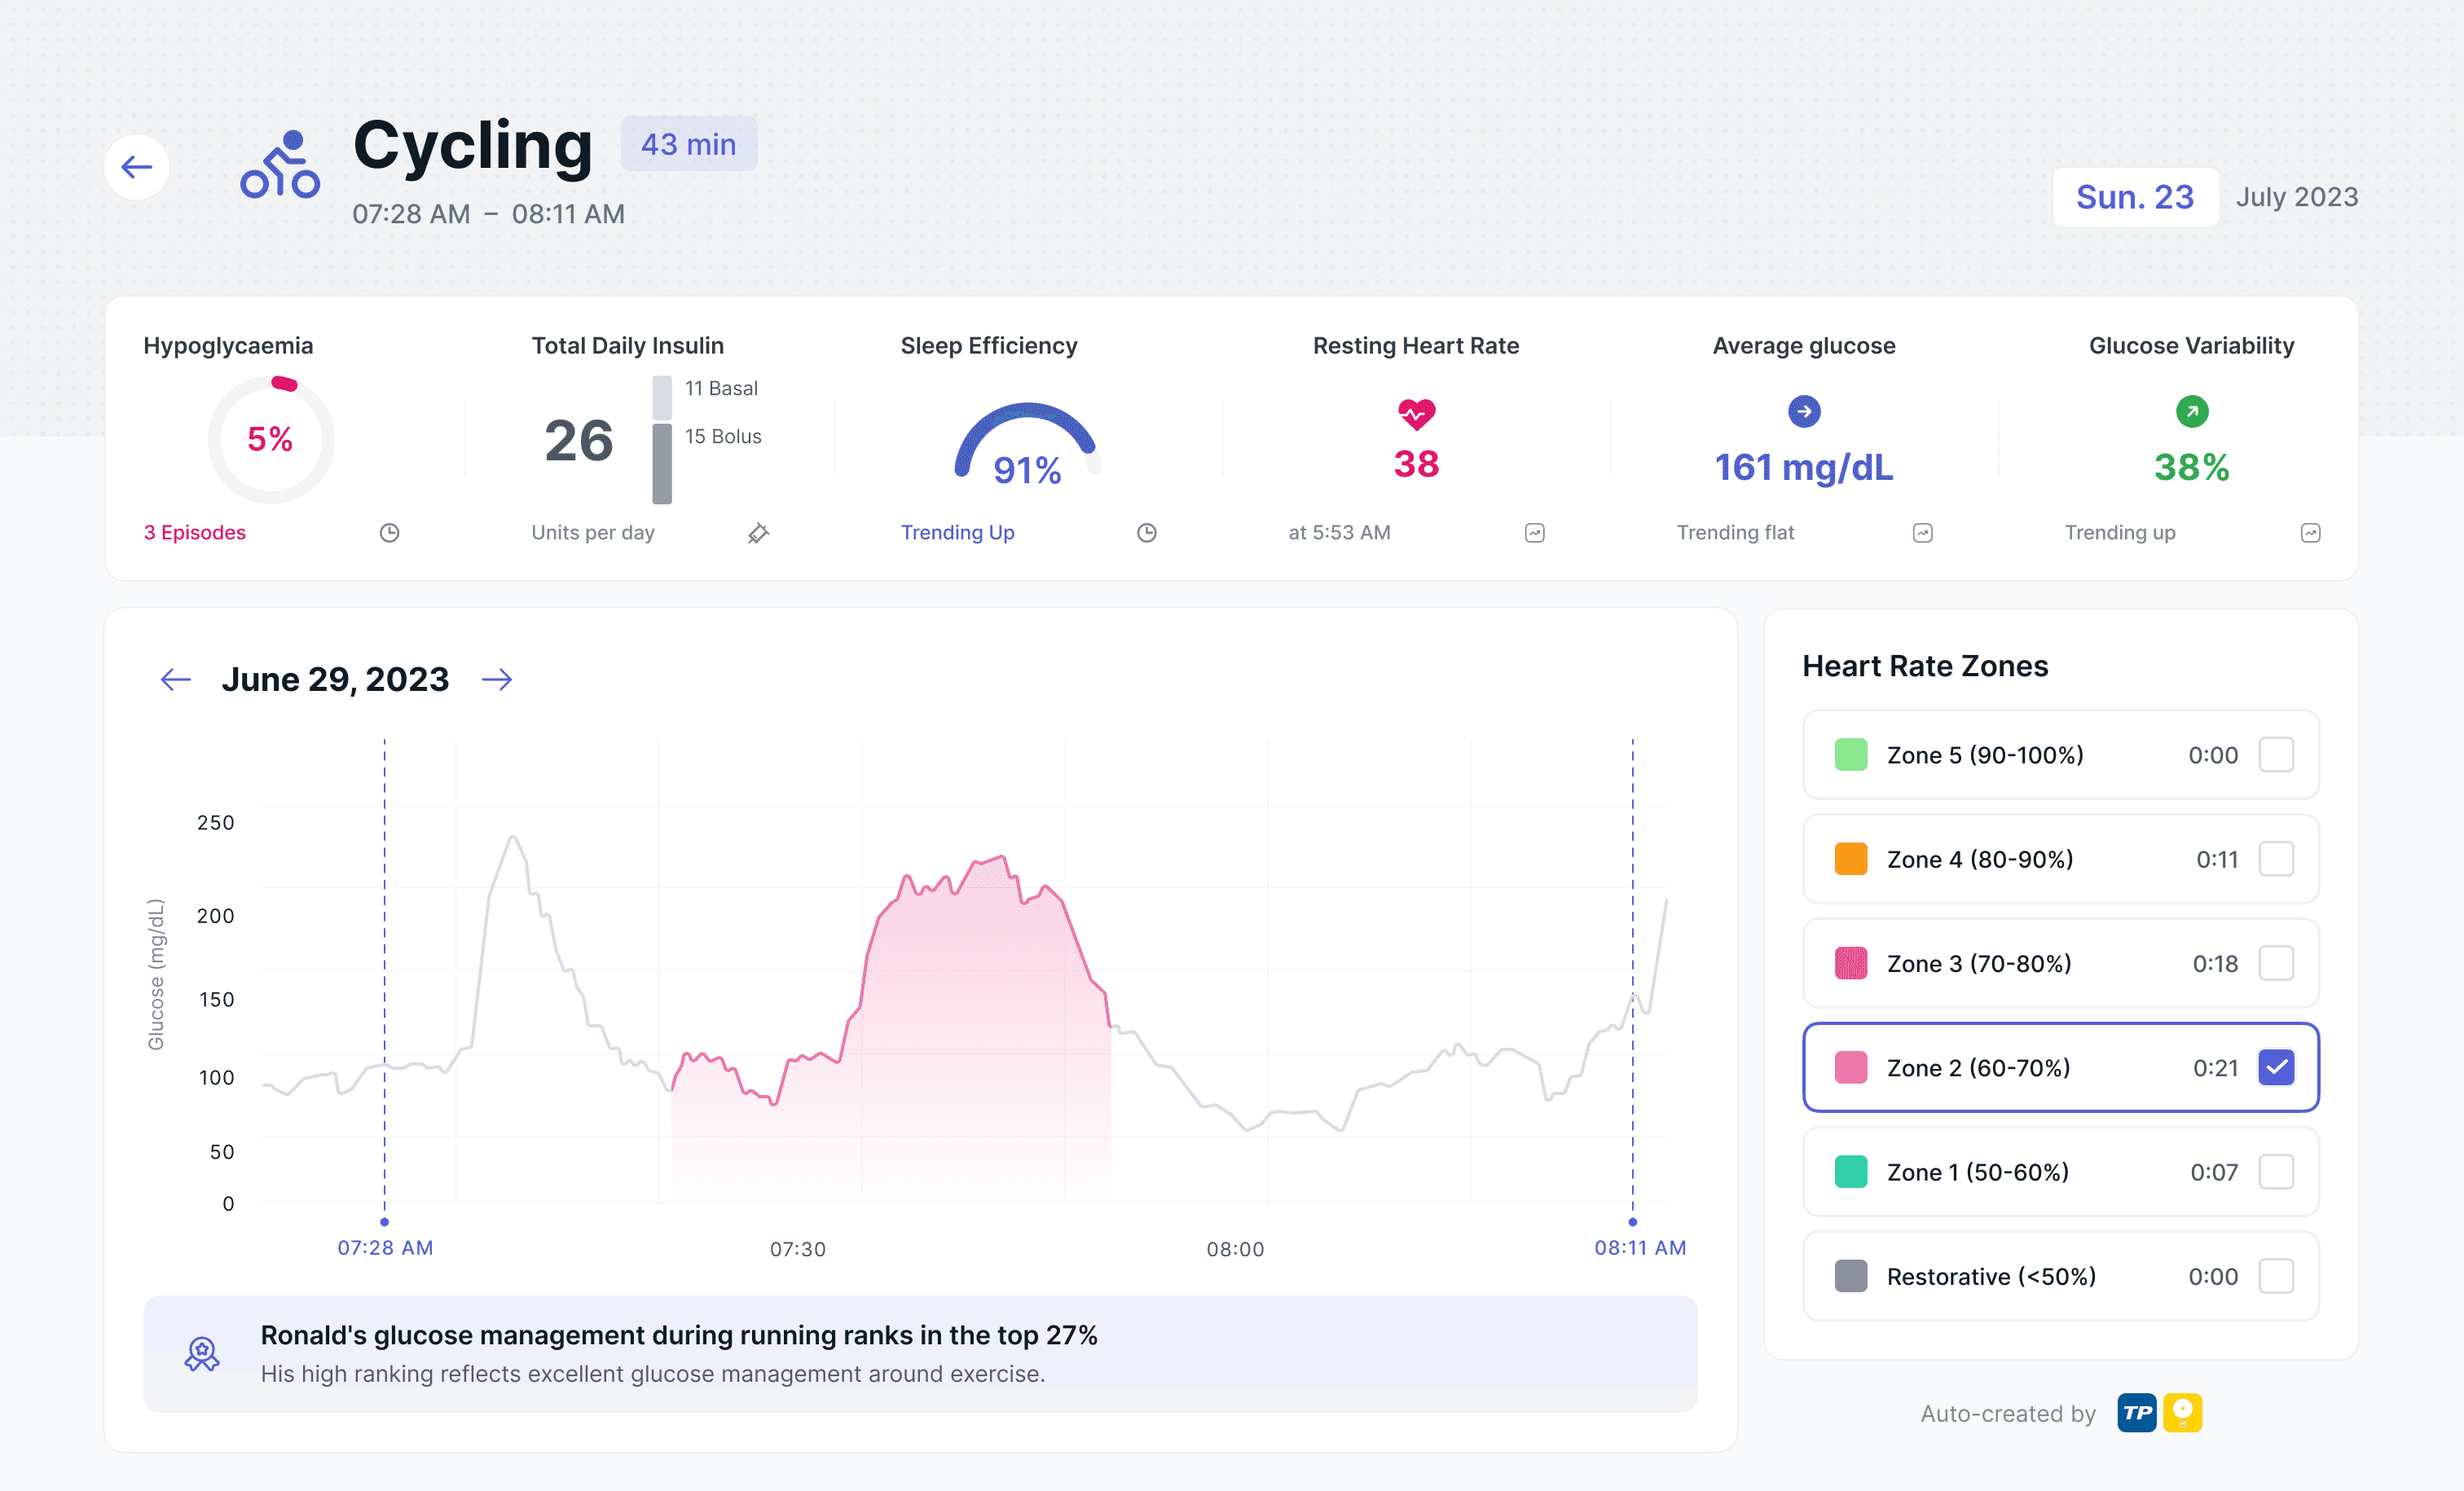
Go inside a single session
Open any workout to see glucose charted through the effort, alongside time in each heart-rate zone, insulin and how it all fits the day.
For you and your care team
Built for real conversations at your next appointment
Daily View
Each day's CGM trace with the exercise, sleep, nutrition and insulin events that shaped it.
Trends
Track a primary metric against a secondary variable over two weeks, a month or six.
Exercise & sleep detail
Drill into a single workout or night - glucose with heart-rate zones or sleep phases.
Reports & export
Export AGP and time-in-range reports as PDF or CSV to share or bring to appointments.
Clinic sharing
Invite your HCP, join a clinic, and control exactly what you share.
Everything connected
CGM, insulin and wearables in one place - no manual export.
For clinics & care teams
The same dashboard, built for your whole clinic
Healthcare professionals use the Enhance-d dashboard to stay connected with active patients between visits. Set up a shared clinic, invite your team, and review exercise-aware glucose data your patients choose to share.
Richer consultation context
Review exercise-aware glucose summaries so appointments focus on what matters.
Shared clinics
Request a clinic, invite doctors and staff, and manage patient groups in one place.
Privacy-first sharing
Patients control what they share. Your team sees meaningful data, not noise.